Financer 2022 Global Report
- 5 January, 2024
- 13 min read
-
 570 reads
2022 Report Summary
The first 6 months of 2022 have been exceptional for Financer.com and its stakeholders. Some of the key metrics were the following:
- 1 million users monthly traffic
- 9 million pageviews
- 586 thousand loan offer clicks
- €50+ million estimated generated loans
In this report, 20 interactive charts and maps show financer.com’s performance for the first 6 months of 2022 compared to the same period in 2021.
All data are retrieved via Google Analytics API and are cross verified via our internal tracking tools.
2022 Global Statistics & Metrics
Users By Market
Of 26 operational markets, 23 saw a rise in visitors in the first half of 2022 compared to 2021. The most visited markets in 2022 were Russia, Romania, Mexico, Spain, Germany, the Netherlands, and Hungary, each receiving more than a quarter of a million visitors in the six-month period.
Global Users Map % Change
This map visualization indicates higher percentile user growth by a darker blue color. Several markets had exponential user increases compared to last year. Indonesia, Poland, Kazakhstan, the US, and Mexico more than doubled their visitor traffic.
Total Users & New Users (Global)
Financer.com welcomed more than 1 million monthly users during Q1 & Q2 of 2022. 6.04 million users visited the site, which is 1.7 million more than in 2021. New users were 5.39 million, 89% of the total.
Bounce Rate By Market
The average bounce rate across all markets has been just 76%, which is 2% less than the previous year, and well below the industry average. The markets with the lowest bounce rates were Indonesia, the US, Georgia, France, and Bulgaria.
Bounce Rate % Change By Market
Few markets experienced a relative increase in bounce rates, primarily due to the rapid growth of organic traffic for informational articles, but most loan-related pages had reduced bounce rates. The most drastic bounce rate reductions were recorded in Indonesia, the US, Bulgaria, and Georgia.
Session Duration By Market
Overall, session durations decreased slightly in 2022, expected due to a larger percentile increase in organic traffic on informational articles with higher bounce rates. Despite the decline, the average session duration remained high at 64 seconds, which is on par with competitor standards.
Pageviews/User By Market
Pageviews per user remained roughly the same in 2022, with a global average of 1.48. The markets with the highest pageviews per user are Indonesia, France, Estonia, Mexico, Italy, Latvia, and Lithuania.
Pageviews Change By Market
Most markets significantly increased their total pageviews in 2022 due to the substantial increase in new users. The biggest pageview gainers were Indonesia, Russia, Romania, Mexico, Kazakhstan, the Netherlands, the US, and Sweden, all experiencing larger than 50% increases.
Global Pageviews
Total global pageviews in the first half of 2022 were close to 9 million, almost 3 million more than last year’s previous period.
Redirected Users % Change By Market
A critical success metric is the number of users who click and redirect to loan offers across our website. Those redirects promote more than 2000 financial products of worldwide financial institutions.
Most markets have seen a significant increase in their total redirected users. The biggest gainers were the US, Indonesia, Russia, Italy, and Mexico, which more than doubled their affiliated traffic compared to the previous year.
Redirected Users Global Avg
In total, 586,115 users clicked on loan offers listed on Financer.com during the first half of 2022, 200+ thousand more than in 2021. This traffic was estimated to generate loans of over €50 million for the financial institutions listed on Financer.com
Redirect Rate By Market
Another critical success rate is how often a website visitor engages with at least one of our loan offers, also known as the Redirect Rate. Redirect rates greatly vary across markets based on ease of lending terms, availability of financial products, economic growth, and financial market stability.
Financer.com has been overperforming the industry standard redirect rates (where available) and their respective loan conversion rates in most markets. The best-performing markets were France, Italy, Mexico, Spain, Latvia, Germany, Georgia, Brazil, and Slovakia.
Redirect Rate Global Avg
The average redirect rate for the entire site was 9.71% in 2022, a stark increase from 8.88% in 2021. With new AI & machine learning split testing tools, we aim to raise the metric to 10% before 2022.
Slider Users % Change By Market
As a financial product comparison engine, one of the key metrics is how often we use our loan comparison tool (known as the “slider”). Increased slider usage indicates more engaged visitors who want to take a loan.
As seen in the chart, most markets saw increases in their slider users, with Indonesia and the Netherlands leading the way.
Slider Users Global Avg
More than 150,000 visitors used the loan comparison sliders between January 1st, 2022, and June 30th, 2022. This is a 27% increase compared to 2021.
Financer.com is experimenting with new tools to allow its users to engage with our content and financial products, which will be presented in next year’s report.
Website Technical Metrics
Another component of success for Financer.com is its top-class page speed and server performance. The development team has been working tirelessly to deliver the fastest, most secure, and most reliable service to more than 1 million monthly users from across the globe.
Below you can see some of our stellar website technical metrics.
Avg. Page Load Time (s)
23 markets have seen a decrease in total page load time, despite increasing the depth of content and interactive graphics. This decrease allows for an even smoother user experience.
Avg. Page Load Time % Change By Market
All countries with excessive speed loading issues in 2021 have been remedied in 2022. The overall weighted average decrease of page load times across all markets was an impressive -24.40%.
Avg. Page Load Time Global Avg (s)
The average page load time for the entire site is just 2.2 seconds, a 0.7 seconds reduction from 2021. The GT Metrix scores for website performance are now a perfect 100%.
Web Vitals Metrics
Similarly, all web vital speed metrics components have been exceptional, with an average collective load of less than half a second. The breakdown can be seen in the accumulative chart below.
Global Web Vitals Metrics Comparison
Components such as domain lookup time, page download time, server connection, and server response time significantly decreased in 2022.
However, technological excellence is only a part of our success: We strive to continuously improve our content, financial products, and partnerships across the 26 markets we operate.
For this reason, since 2021, we have created Trusted Partners, an exclusive program to give more privileges to affiliate partners who have a high customer service record with our users.
Trusted Partners Progam
Program features
The Trusted Partner Program is designed to reward our loyal partners with exclusive features that will improve their reputation and profitability. There are three main unique features:
1. Verification badge
Each Trusted Partner will have a blue verification badge next to its logo that will be shown across several touchpoints throughout the Financer.com site, including the company’s main description page.
2. Directly reply to users
Trusted Partners can directly reply to users’ reviews and request re-evaluation after addressing their issues.
3. Mark reviews as “inaccurate.”
Trusted Partners can also mark spam or malicious reviews as “inaccurate” after conducting their due diligence. Inaccurate reviews are not counted in the average review score and are shown with faded colors and warning labels.

Learn more about the Trusted Partners program here, or directly apply to enroll using the button below:
Growth in 2022 and beyond
The team of Financer.com is committed to keeping a world-class service to all our stakeholders. We will keep prioritizing providing the most well-researched financial content and the most extensive database of financial products to our users. Additionally, we commit to expanding our services to cover growing needs in the sphere of finance.
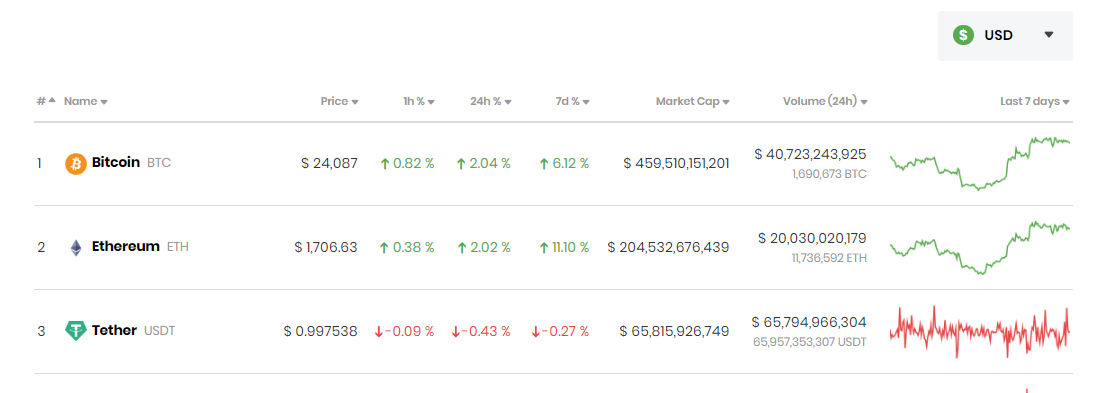
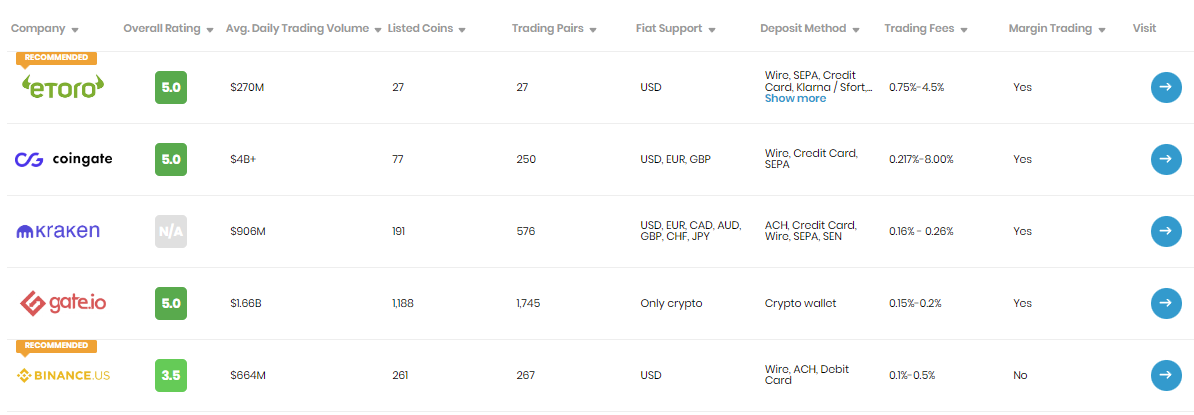
For this reason, In 2022, we have launched a series of cryptocurrency content, including comparison pages of the top cryptocurrencies and cryptocurrency exchanges across 26 countries.
We have also added peer-reviewed mechanisms in our content to allow other finance experts to contribute and verify our data.
Moreover, we included new user feedback collection options across all our posts to help us optimize our content further.
For the second half of 2022, we are working on delivering more quantitive data reports and charts evaluating global economic and financial indicators. Major upgrades will also be implemented to increase community engagement, feedback, and rewards.
Last, we are working on improving our internal tracking systems and delivering more AI experiments and optimizations based on performance metrics that will help our partners increase their profitability.
If you have any questions about this report, please let us know using this contact form.