What is the Unemployment rate?
The US unemployment rate reflects the percentage of the workforce actively seeking employment. The rate and trends in unemployment are important economic indicators used to forecast economic growth, inflation, and interest rates.
Employment data is collected and published by the Bureau of Labor Statistics. The unemployment rate for each month is published on the first Friday of the following month.
How to calculate the Unemployment rate?
The unemployment rate is calculated by dividing the number of people actively seeking employment by the number of people in the workforce. It is expressed as a percentage.
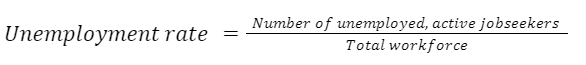
Job seekers are only counted if they have been actively seeking employment over the previous four weeks. Individuals who are employed part time are counted as employed, even if they are looking for full-time employment.
The method above is for the most commonly cited U-3 unemployment rate. Some economists prefer to use the U-6 unemployment rate, which includes job seekers who have stopped looking for work. This U-6 number is sometimes referred to as the true unemployment rate.
What is the unemployment rate?
The current US Unemployment rate for February 2022 was 3.8%.
The unemployment rate has fallen from 6.2% in February 2021 to 3.8% in February 2022, its lowest level since early 2020.
Key unemployment rate trends and levels
The US unemployment rate has fluctuated between 2.5% and 14.8% since 1950. Prior to that, it peaked at 24.9% in 1933 during the great depression. The lowest recorded level was 1.2% in 1944. The average rate since 1950 has been 5.76%.
Unemployment is highly correlated with GDP growth and rises whenever there is a recession. However, it typically increases after GDP growth has already fallen and rises after GDP growth recovers.
The most significant increases in unemployment occurred during the recessions of 1974/1975, 1981/1982, the global financial crisis in 2008 and the Covid-19 pandemic in 2020. The recession in 2020 resulted in the highest unemployment rate in recent decades.
How to use the Unemployment rate?
The unemployment rate is correlated with GDP growth, but lags growth and stock prices. However, it provides valuable information about likely monetary and fiscal policy, which can affect the stock market and specific sectors of the economy.
It’s not surprising to see that unemployment, GDP growth and stock prices are correlated. When the economy contracts, corporate profits fall and businesses are prone to lay off staff. This can create a vicious cycle as rising unemployment impacts business and consumer confidence, as well as spending.
High unemployment rate
When unemployment rises above 6% or 7%, policy makers will usually act to improve economic conditions, and will be more reluctant to raise interest rates. They may also provide monetary and fiscal stimulus to reignite the economy. In isolation, this is positive for stocks, although there are other factors to consider too. Rising unemployment is accompanied by market volatility and uncertainty.
When unemployment rises, investors should pay attention to interest rates. The Fed Funds rate will reflect the central bank’s stance, while the 10Y treasury yield will typically reflect investor expectations.
Spikes in unemployment have historically provided buying opportunities for stock market investors, although it’s difficult to determine the exact time to invest.
Low unemployment rate
The economy is regarded as being in good shape when unemployment falls below 5%. This is positive for the economy, but can lead to inflation and rising interest rates. When the market anticipates rising interest rates, cyclical sectors like financials and commodity producers tend to outperform. A strong economy also benefits consumer discretionary, construction, real estate and manufacturing industries.
The stock market can perform well when unemployment falls gradually. However, a sudden or unexpected decline in unemployment can lead to short term volatility as the market digests the prospect of higher rates.
Because the unemployment rate is a lagging indicator, analysts also keep a close eye on Jobless Claims data, which is released weekly. This data is more up to date and can provide insights into the direction of the unemployment rate. Analysts also look at non-farm payroll data, which gives a better idea of the number of jobs being created in the economy.
To give the unemployment data more context, you can consider it alongside market sentiment indicators like:
- AAII Sentiment
- VIX Index
- S&P Market-Cap Concentration
- Personal Savings Rate
- Buffet Indicator
- Put/Call Ratio
- Margin Debt to Cash
- Velocity of M2 Money Stock
- Debt / GDP ratio
- DXY Rate
- Shiller P/E ratio
What are the limitations of the Unemployment rate?
As mentioned, the unemployment rate is a lagging indicator, so stock prices tend to move before the employment data. During recessions, unemployment rises while stock prices fall, but it’s difficult to predict how high it will rise or how long it will rise for.
The unemployment rate is affected by seasonality, as job creation is typically better during certain months of the year. Any changes in employment data should be compared to the same month during the previous year.
The commonly cited U-3 unemployment rate doesn’t include discouraged job seekers. It also doesn’t account for underemployment – i.e. people who have part time jobs or jobs that don’t match their qualifications and experience. That means that while unemployment may be falling, job seekers may be accepting inferior jobs and lower wages.
Is the Unemployment rate a reliable indicator?
Unemployment data is reliable, but often lags stock prices. It can’t always be used to time the market, but can provide valuable context about the likely direction of interest rates, corporate profits and consumer confidence.
Besides the Unemployment rate, you can use our complete list of 12- essential market indicators to make educated financial decisions.