What is the Velocity of M2 Money Stock?
The velocity of money reflects the number of times each unit of a currency is ‘used’ or exchanged in a given period. The velocity of money is indicated for a specific classification of money supply.
By monitoring the velocity of money, we can gain insights into business and consumer confidence, which in turn affects economic growth. We typically see higher velocity when an economy is expanding and lower velocity if an economy is contracting.
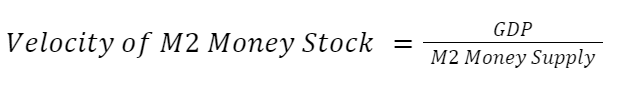
The Velocity of M2 Money Stock reflects the velocity of assets that fall within the definition of M2 money. It is reflected as a ratio of GDP to M2 money supply, so it indicates the number of times each dollar is used to generate the economy’s output.
How to calculate the Velocity of M2 Money Stock?
The velocity of M2 money is calculated by dividing the GDP (gross domestic product) for a given period by the average money supply for that period.
M1 money supply includes cash and bank deposits.
M2 money supply includes M1 money as well as savings deposits, money market securities and time deposits.
The Velocity of Money is published quarterly when GDP figures are reported.
What is the current Velocity of M2 Money?
As of Fourth quarter the US Velocity of M2 Money was 1.123.
During 2021, money supply remained in a tight range between 1.115 and 1.123.
Historically, money supply peaked at 2.192 in 1997 and fell to its lowest level of 1.10 during the Covid-19 pandemic in 2020.
Key Velocity of Money trends and levels
The velocity of M2 money has been calculated since 1959. It remained between 1.65 and 1.9 until the 1990s when it rose to 2.19. Since its peak in 1997, money velocity has declined steadily.
The steadily decline and record low levels in money velocity of the last two decades has been attributed to several factors:
- Monetary policy: Over the last two decades, and particularly since the global financial crisis, monetary policy has been expansionary. This has had the effect of increasing the money supply relative to the amount of economic activity. Banks have also been reluctant to make loans while interest rates were at such low levels which has slowed the pace of new credit entering the financial system.
- Demographics: Certain demographic shifts that have occurred may have also contributed to the decline in money velocity. The large ‘baby boomer’ generation has entered retirement during this period and may have cut back on spending. At the same time, younger generations are focused on paying off debt rather than spending.
The decline in the velocity of money may not seem apparent when one looks at GDP growth or the stock market. However, a lot of growth over the last decade has occurred in the highly productive tech sector and the digital economy. ‘Real economy’ sectors like manufacturing have underperformed which has resulted in fewer transactions in those parts of the economy.
Typically an increase in the money supply would result in inflation and tighter monetary policy which would reduce the money supply. However, deflationary forces have offset the higher money supply until recently. This has caused money velocity to continue to decline.
How to use the Velocity of M2 Money Stock?
The velocity of M2 money doesn’t directly affect the stock market, but it can provide some context for economic conditions. Most economic indicators are flawed in one way or another, so it’s useful to consider several.
When looking at the health of an economy, GDP growth and employment figures like the unemployment rate are the primary indicators. However, if they suggest the economy is in good shape while money velocity is declining, there may be problems that are not immediately apparent. This has been the case in the US over the past decade, with strong performance in some sectors of the economy masking weak performance in other sectors.
Declining money velocity may explain the underperformance of cyclical stocks over the past decade despite reasonable growth rates and low unemployment. It may also explain some asset price bubbles as investors choose to leave their savings in stocks or bonds rather than investing in small businesses.
Such metrics should include:
- AAII Sentiment
- VIX Index
- S&P Market-Cap Concentration
- Personal Savings Rate
- Buffet Indicator
- Put/Call Ratio
- Margin Debt to Cash
- DXY Index
- Debt / GDP ratio
- Unemployment rate
- Shiller P/E ratio
What are the limitations of the Velocity of M2 Money Stock?
Money velocity has little correlation with the stock market or economic growth. In the short term, the velocity of money almost always declines during a recession. However, it doesn’t always rise during an expansionary period.
Money velocity can change when central banks employ different tools to manage growth and inflation. This means the velocity of money for one period isn’t always comparable to the velocity during a previous period.
Is the Velocity of M2 Money Stock a reliable indicator?
Money velocity isn’t really correlated with the stock market in any meaningful way. However, it can help us understand whether an economy is as healthy or weak as headline figures suggest.
In addition to the Velocity of M2 Money Stock, you can use our complete list of 12- essential market indicators to make educated financial decisions.