What is the Shiller P/E Ratio?
The Shiller P/E Ratio is a valuation metric that shows the multiple that the current price of a stock or index is trading over its inflation-adjusted, 10-year average earnings. Also commonly known as the Price Per Earnings ratio, Cyclically Adjusted Price to Earnings (CAPE) Ratio, CAPE, or P/E 10 Ratio.
The ratio was publicized in the 1980s by the Yale University professor and Nobel Prize Laureate Robert Shiller and is now widely considered among the most reliable stock valuation indicators.
It is often applied to leading stock market indices, such as the S&P 500 or individual stocks, as an indicator of potential overvaluation or undervaluation compared to the assumed intrinsic value.
How to calculate the Shiller P/E Ratio?
The formula to calculate the Shiller P/E Ratio is the current price of a stock or index, divided by the 10-year average earnings, adjusted for inflation.
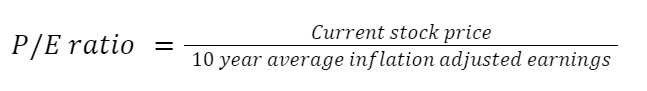
In this formula, Inflation-adjusted earnings deduct the annualized inflation rates from annual earning figures.
The 10-year average figures use the arithmetic average (also known as simple average) of the inflation-adjusted earnings, thus putting equal weight on each of the last 10 accounted years.
What is the current Shiller P/E Ratio?
The current Shiller P.E Ratio for the S&P 500 is 39.89. Last month the ratio was at 38.68, and a year ago was at 34.51. In fact, the ratio is now at its highest level in the last 20 years.
The current level shows an over-extension of over 100% from the last 20-year historical average, which had always resulted in abrupt market crashes.
What is a good P/E ratio for investing?
The first step to defining a good P/E ratio for investing is to compare it with relevant P/E averages.
- The Industry P/E average
- The Index P/E average
- The company’s P/E average
- The top 3 closest competitor’s P/E average
If the P/E ratio of stock ranges close to each of those four averages, it may be considered fairly valued. Conversely, consistently higher P/Es can show overvaluation, and consistently lower P/Es can show undervaluation.
Despite how relative a high or low P/E ratio can be in the last 2 decades, there are some rough estimates that we can use to determine which P/E levels can be deemed as high, average or low:
4.1 High P/E ratio
The highest ever average P/E ratio for the S&P 500 was 44.19, recorded on Dec 1999, right before the .com bubble crash. Today, the P/E is dangerously close to the same levels, close to 40.
Typically, P/E values above 30 are high, even though it is always important to consider the relative P/E value of a stock or index as well.
For example, the NASDAQ’s P/E Average in the last 20 years has been above 30, while the Dow Jones is closer to 15.
In bull markets, high P/E ratios are often found in risk-on assets and industries, such as information technology, consumer discretionary, and financials.
4.2 Average P/E ratio
Different market indices and sectors verify significantly on the average P/Es:
The average P/E Ratios for the Dow Jones indices are respectively: Industrials at 18.71, Transportation at 20.59, and Utilities at 21.50.
The S&P 500 traditionally has a significantly higher P/E than the DOW, with a 10 year average of 26.1. The historic P/E average for the S&P 500 since 1870 is 16.90 and has been monotonically increasing every single decade until today.
However, the king of extremely high P/E ratios during bull cycles is the NASDAQ 100, which has an average P/E of 29.1, which is over 50% bigger than the DOW Industrial index.
Even though such a P/E of 29.1 is considered quite high for most indices, for the tech-heavy NASDAQ index, it’s rather considered a normal expectation considering the exponential growth that is typically observed in tech stocks
4.3 Low P/E ratio
The historical minimum for the S&P 500 P/E ratio was 4.78 in the 1920s. The most recent low figure in the last 20 years had been 15.05.
Accounting for current trends, a low P/E ratio is typically considered being below 20 for most sectors.
In bull markets, low P/E ratios are hard to find and primarily identified in more traditional and established companies in the sectors of commodities, energy, utilities, material, industrials, and consumer staples.
How to use the Shiller P/E Ratio?
The Shiller P/E ratio is a reliable measure of valuation when compared against the historic P/E ranges and averages of the same stock, as well as when compared to its industry, index, and close competitors.
However, the ratio must also be together with other market metrics:
AAII Sentiment
VIX Index
Personal Savings Rate
Buffet Indicator
Put/Call Ratio
Margin Debt to Cash
Velocity of M2 Money Stock
Debt / GDP ratio
Unemployment rate
DXY Index
Qualitative factors also need to be considered, such as the current monetary policies, the political climate, market confidence expectations, etc.
Roughly speaking, in a market with a bullish horizon, higher P/E ratios are the norm, as investors’ expectation is for the earnings to grow in the short-medium term.
Such optimistic expectations allow investors to overtake higher risk and volume investments, which appreciates the current stock’s price and increases the P/E ratios.
What are the limitations of the Shiller P/E ratio?
There are several issues with using the Shiller P/E ratio as a standalone valuation metric.
- The P/E ratio only accounts for the equity of an asset or index, but not for the underlying debt. Companies holding very high debt or leverage positions will not be indicated in the metric.
- The P/E ratio gives equal validity to average earnings occurring annually for the last ten years but fails to capture recent earnings growth trends.
- The P/E ratio is susceptible to sudden volatile market prices, which can be distorted and manipulated easily.
- The P/E ratios fail to consider the qualitative traits and prospects of a company and the broad economic environment.
Is the Shiller P/E Ratio a reliable indicator?
The short answer is that yes, the Shiller P/E ratio has been one of the most consistent indicators to warn about long-term undervalued or over-valued stocks and indices.
Several academic studies have proven the validity of the ratio to predict both bear markets and bull markets.
While the ratio has a fair amount of drawbacks, it is an essential tool in the arsenal of a strategic investor.
In addition to the Shiller P/E Ratio, you can use our complete list of 12- essential market indicators to make educated financial decisions.