Blog article
Put/Call Ratio Explained: Your Guide to Market Sentiment
The put/call ratio measures the volume of put options versus call options traded on a given day. It's widely used as a contrarian indicator to gauge market sentiment and anticipate potential reversals.
 Adheres to

 Edited by Abraham Jimoh
5 Min read | Invest
The put/call ratio is one of the simplest and most widely followed sentiment indicators in the options market. It compares the number of put options traded to the number of call options traded on a given day.
When traders are nervous, they buy more puts. When they're optimistic, they buy more calls. The ratio captures that shift in real time.
As of early March 2026, the CBOE equity put/call ratio sits at 0.67, while the total put/call ratio (equity + index options combined) is at 0.96. The equity ratio recently spiked to 1.28 in late February, its highest reading in over 12 months, signaling a sharp increase in bearish positioning among stock traders.
What Is the Put/Call Ratio?
The put/call ratio measures market sentiment by dividing the total volume of put options traded by the total volume of call options traded during a specific period.
Put options give the buyer the right to sell an asset at a set price. Traders buy puts when they expect prices to fall or want to hedge downside risk. Call options give the buyer the right to buy an asset at a set price, and traders buy calls when they expect prices to rise.
A ratio above 1.0 means more puts are trading than calls, which signals bearish sentiment. A ratio below 1.0 means more calls are trading than puts, suggesting bullish sentiment.
The ratio is most commonly used as a contrarian indicator. The logic is straightforward: when everyone is bearish (high ratio), the selling may be overdone and a bounce could follow. When everyone is bullish (low ratio), the market may be due for a pullback.
How Is the Put/Call Ratio Calculated?
The formula is simple:
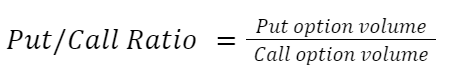
For example, if 500,000 put options and 750,000 call options traded on a given day, the put/call ratio would be 0.67. That reading tells you there were roughly two call options traded for every three put options.
There are several variations on the time frame used:
- Daily volume tracks the ratio for a single trading session
- Weekly or rolling 5-day volume smooths out daily noise
- Open interest uses the total number of outstanding option contracts rather than daily volume
Most references to "the" put/call ratio use daily volume data from the Chicago Board Options Exchange (CBOE), the largest options exchange in the world.
Equity, Index, and Total Put/Call Ratios
The CBOE reports three separate put/call ratios, and each one tells a different story.
Equity put/call ratio (CPCE) tracks options on individual stocks. Retail traders dominate this market. They have a persistent bullish bias, so the equity put/call ratio almost always stays below 1.0. The 200-day moving average sits around 0.61.
Index put/call ratio (CPCI) tracks options on market indices like the S&P 500. Professional fund managers are the primary players here, and they frequently use index puts to hedge portfolio risk. Because of that structural hedging demand, the index ratio typically stays above 1.0, with a 200-day moving average around 1.41.
Total put/call ratio (CPC) combines equity and index options into a single reading. It oscillates around 0.91 on a 200-day average and provides the broadest view of overall market sentiment.
As of March 2026, the current readings are:
- Equity put/call ratio: 0.67
- Index put/call ratio: 1.12
- Total put/call ratio: 0.96
Why the distinction matters
A spike in the equity put/call ratio is generally a stronger contrarian signal than a spike in the index ratio. Index put buying often reflects routine hedging by institutions, not panic. Equity put buying tends to reflect actual fear among individual investors.
What Is a Good Put/Call Ratio?
There is no single "good" number because the typical range shifts over time as market conditions change. That said, the historical averages from 2007 to 2022 provide useful benchmarks for the total put/call ratio:
- The long-term average was 0.97
- Extreme bearishness (top 5% of readings): ratio above 1.23
- Extreme bullishness (bottom 5% of readings): ratio below 0.72
For the equity put/call ratio specifically, these thresholds are generally recognized:
| Equity P/C Ratio | Sentiment | Contrarian Signal |
|---|---|---|
| Below 0.45 | Extreme bullishness | Potential bearish reversal |
| 0.45 - 0.55 | Moderately bullish | Normal range |
| 0.55 - 0.70 | Neutral to mildly bearish | Normal range |
| Above 0.70 | Elevated bearishness | Potential bullish reversal |
| Above 1.0 | Extreme bearishness | Strong bullish reversal signal |
These thresholds are not fixed rules. They shift depending on the prevailing market regime. During prolonged bull markets, the "extreme" upper threshold may need to be adjusted lower. During volatile bear markets, readings that look extreme in normal times might be the new normal.
The key is to compare current readings against the highs and lows of the previous 6 to 12 months rather than relying on static cutoffs.
High brokerage fees are eating your profits
Save thousands by choosing the best investment broker in 2026. Compare the options for free within minutes.
Compare investment brokers here!
How To Use the Put/Call Ratio
The put/call ratio is primarily a contrarian timing tool, but it can serve multiple purposes depending on your trading horizon.
Short-term reversal signals. Day traders and swing traders watch for spikes to extreme highs or lows. When the ratio spikes well above recent norms, it suggests traders are overly bearish and a bounce may be imminent. When it drops to unusually low levels, it signals complacency that could precede a sell-off.
Trend confirmation with moving averages. Smoothing the ratio with a 10-day or 21-day moving average removes daily noise and reveals the underlying trend. A rising moving average indicates growing bearishness, while a declining one reflects increasing optimism. Crossovers between short-term and long-term moving averages can also signal momentum shifts.
Combining with other indicators. The put/call ratio works best as a confirming signal rather than a standalone trigger. Pairing it with complementary indicators adds context:
Shiller P/E Ratio for long-term valuation context
DXY Index for dollar strength and its impact on equities
Debt/GDP Ratio for macro fiscal backdrop
AAII Sentiment for retail investor survey data
Velocity of M2 Money Stock for monetary conditions
The VIX (CBOE Volatility Index) for implied volatility levels
SPY and Individual Stock Put/Call Ratios
Beyond the broad CBOE ratios, you can also track put/call ratios for individual securities. The SPY put/call ratio (covering S&P 500 ETF options) is one of the most popular, with a monthly search volume of around 1,000.
Individual stock put/call ratios can reveal sentiment shifts for specific companies. For example, NVDA's put/call ratio spiked during periods of AI hype uncertainty, while SPY's ratio tends to mirror the broader equity put/call ratio.
You can find put/call ratios for individual stocks and ETFs on platforms like Barchart, Yahoo Finance, and most brokerage platforms with options data. Keep in mind that individual stock ratios are noisier than broad market ratios because a single large trade can skew the reading significantly.
Put/Call Ratio vs. the VIX
Both the put/call ratio and the VIX measure market sentiment, but they capture different dimensions of it.
The put/call ratio reflects actual trading behavior. It tells you what options traders are doing with their money right now. The VIX, on the other hand, reflects expected volatility. It measures how much the market thinks the S&P 500 will move over the next 30 days based on option prices.
In practice, both tend to spike during periods of fear, but they can diverge. The VIX can stay elevated even as the put/call ratio normalizes, particularly when institutional hedging programs keep option premiums inflated.
Using both together gives you a more complete picture. A spike in the put/call ratio combined with an elevated VIX is a stronger signal of capitulation than either one alone.
Limitations of the Put/Call Ratio
The put/call ratio is a useful tool, but it has real limitations you should understand before relying on it.
It doesn't distinguish motive. A surge in put buying might reflect genuine fear, or it might just be institutional hedging. The ratio treats both the same way, which can produce misleading signals.
There's no universal threshold. Extreme readings shift over time. A ratio of 0.80 might be bearish in one market regime and perfectly normal in another. You need to contextualize every reading against recent history.
Daily data is noisy. Single-day spikes can be driven by a few large block trades rather than a broad shift in sentiment. Smoothing the data with moving averages helps, but it adds lag.
It's not a timing tool. The ratio can signal that sentiment is stretched, but it can't tell you when the reversal will happen. Bearish sentiment can stay extreme for days or weeks before prices actually turn.
Options market structure is evolving. The explosive growth of 0DTE (zero days to expiration) options has changed the volume dynamics of the options market. Traditional put/call ratio interpretations may need adjustment as these ultra-short-dated contracts represent an increasing share of total volume.
Where To Find Put/Call Ratio Data
If you want to check the put/call ratio today, several free and paid sources provide real-time and historical data:
- CBOE (cboe.com) publishes daily market statistics including equity, index, and total put/call ratios
- Barchart provides put/call ratio charts for the S&P 500 and individual stocks
- MacroMicro offers interactive historical charts of the CBOE total put/call ratio
- TradingView has the CBOE put/call ratio available as a chartable indicator (ticker symbols: CPCE, CPCI, CPC)
- StockCharts provides real-time put/call ratio charts with customizable moving averages
- FRED (Federal Reserve Economic Data) maintains historical CBOE market statistics
Frequently Asked Questions
 What does a put/call ratio of 0.7 mean?
A put/call ratio of 0.7 means that for every 10 call options traded, 7 put options were traded. Since the ratio is below 1.0, it indicates that traders are buying more calls than puts, which suggests overall bullish sentiment in the market.
Is a high put/call ratio bullish or bearish?
A high put/call ratio (above 1.0) directly reflects bearish sentiment because more puts are being traded than calls. However, as a contrarian indicator, extreme high readings are often considered bullish signals because they suggest the market may be oversold and due for a reversal.
What is the current CBOE put/call ratio?
As of early March 2026, the CBOE equity put/call ratio is 0.67, the index put/call ratio is 1.12, and the total put/call ratio is 0.96. You can find the latest daily readings on the CBOE website.
How is the put/call ratio different from the VIX?
The put/call ratio measures actual trading activity (the volume of puts vs. calls being traded), while the VIX measures expected volatility based on S&P 500 option prices. Both gauge fear and greed, but they capture different dimensions of sentiment and can sometimes diverge.
Can you use the put/call ratio for individual stocks?
Yes. You can track the put/call ratio for individual stocks and ETFs like SPY or NVDA on platforms such as Barchart, Yahoo Finance, and most brokerage platforms. Individual stock ratios tend to be noisier than broad market ratios because single large trades can skew the reading.
Comments
Only registered users can leave comments.