Blog article
Shiller P/E Ratio (CAPE): Your Guide to Market Valuations in 2026
Uncover how the Shiller P/E Ratio, also known as CAPE, helps forecast market performance and can guide your long-term investment strategy.
 Adheres to

 Edited by Abraham Jimoh
7 Min read | Invest
As of March 2026, the Shiller P/E Ratio for the S&P 500 stands at approximately 38.2, well above the historical mean of 17.34. While the ratio pulled back slightly from its late-2025 peak near 40, current valuations remain the second-highest in over 140 years of market history, trailing only the dot-com bubble peak of 44.19 from December 1999.
What is the Shiller P/E Ratio Right Now?
You can check the current Shiller P/E Ratio by following this link to Multpl or this link to GuruFocus.
What is the Shiller P/E Ratio?
The Shiller P/E Ratio is a valuation metric that shows the multiple that the current price of a stock or index is trading over its inflation-adjusted, 10-year average earnings. Also commonly known as the Price Per Earnings ratio, Cyclically Adjusted Price to Earnings (CAPE) Ratio, CAPE, or P/E 10 Ratio.
The ratio was developed in the 1980s by Yale University professor and Nobel Prize Laureate Robert Shiller and is now widely considered among the most reliable long-term stock valuation indicators. However, it's important to understand that "long-term" means 10-20 years, not next month or next year.
Unlike regular P/E ratios that can swing wildly based on whether a company had a great quarter or a terrible one, the Shiller P/E looks at a full decade of earnings. This helps smooth out the natural ups and downs of business cycles, economic recessions, and temporary booms to give you a clearer picture of what stocks are really worth.
It is most commonly applied to broad stock market indices like the S&P 500, though it can also be calculated for individual sectors or even specific companies as an indicator of potential overvaluation or undervaluation compared to historical norms.
How to Calculate the Shiller P/E Ratio
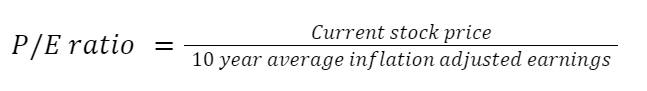
The formula to calculate the Shiller P/E Ratio is the current price of a stock or index, divided by the 10-year average earnings, adjusted for inflation.
Here's how it works step by step:
Step 1
Gather the last 10 years of annual earnings per share data.
Step 2
Adjust each year's earnings for inflation to bring them into today's dollars.
Step 3
Calculate the simple average of those 10 inflation-adjusted earnings figures.
Step 4
Divide the current stock price by that average.
For example, if the S&P 500 is trading at $5,600 and the 10-year inflation-adjusted average earnings per share is $140, the Shiller P/E would be 40.
In this formula, inflation-adjusted earnings account for the fact that $1 of earnings in 2016 is worth more than $1 of earnings today due to inflation. This adjustment ensures we're comparing apples to apples across different time periods.
The 10-year average uses the arithmetic average (simple average) of the inflation-adjusted earnings, giving equal weight to each of the last 10 years. This approach intentionally smooths out short-term fluctuations to reveal longer-term valuation trends.
Current Shiller P/E Ratio: What the Numbers Show
As of early 2026, the Shiller P/E Ratio for the S&P 500 sits at approximately 38.2, according to GuruFocus. This remains the second-highest sustained level in over 140 years of market data, exceeded only by the dot-com bubble peak of 44.19 in December 1999.
To put this in perspective:
- 140+ year historical mean: 17.34
- Historical median: 16.07
- Recent 20-year average: 27.5
- Current level: ~38.2 (39% above the 20-year average, 120% above the long-term mean)
- All-time high: 44.19 (December 1999)
What This Means for Future Returns
At current levels, the implied future annual return is approximately 2.3% over the next decade, according to GuruFocus data. This is far below the historical stock market average of 7-10%. Major investment firms are echoing this cautious outlook:
- Vanguard: 4-5% average nominal returns over the next 5-10 years for U.S. equities, with stronger risk-return profiles for value-oriented equities and non-U.S. developed markets
- Research Affiliates: Projected real returns below 1% for U.S. large caps over the coming decade
However, it's crucial to understand that these are long-term forecasts. The Shiller P/E has virtually zero ability to predict what will happen next month, next quarter, or even next year.
The Magnificent Seven Problem
Here's something most investors don't realize: just seven companies (Apple, Microsoft, Google, Amazon, Nvidia, Meta, and Tesla) now represent about 33% of the entire S&P 500, down slightly from a peak of 34.3% in late 2025. Nvidia alone has a Shiller P/E well above 200, which is mathematically pulling the entire index higher. If you removed these seven companies, the S&P 500's Shiller P/E would drop significantly, telling a different story about broad market valuation.
What is a Good P/E Ratio for Investing?
The first step to defining a good Shiller P/E ratio for investing is to compare it with relevant historical averages and understand what different levels typically mean for future returns.
Historical Context:
- Very Low (under 15): Typically signals excellent long-term buying opportunities
- Average (15-25): Suggests fair valuation with normal expected returns
- High (25-35): Indicates expensive valuations with below-average future returns likely
- Very High (35+): Historically associated with poor long-term returns and increased crash risk
However, there's an important debate happening right now about whether these historical benchmarks still apply.
Key Comparisons to Make
Compare to the 100+ year historical average (17.32)
Compare to recent 20-year average (27.3)
Compare to sector-specific CAPE ratios
Consider the current interest rate environment
Look at international market valuations for context
The "New Normal" Debate
Some experts argue that structural changes in the economy justify higher valuations today:
- Lower interest rates reduce the discount rate for future earnings
- Higher profit margins due to technology and globalization
- Share buybacks have replaced dividends, changing how companies return cash to shareholders
- Passive investing creates constant buying pressure regardless of valuations
Sector Differences Matter
Not all parts of the market are equally expensive. Based on Siblis Research data as of late 2025:
- Information Technology: CAPE of 64.5 (extremely expensive)
- Consumer Discretionary: CAPE of 40.2 (very expensive)
- Communications: CAPE of 39.8 (very expensive)
- Health Care: CAPE of 25.8 (closer to historical norms)
- Financials: CAPE of 21.7 (the cheapest sector)
This means your investment strategy might focus on undervalued sectors rather than avoiding stocks entirely.
High brokerage fees are eating your profits
Save thousands by choosing the best investment broker in 2026. Compare the options for free within minutes.
Compare investment brokers here!
How to Use the Shiller P/E Ratio Effectively
The Shiller P/E ratio is a powerful tool, but only when used correctly. Here's how smart investors actually use it:
For Long-Term Planning (10+ years):
- Use CAPE to set realistic return expectations
- Consider reducing equity allocation when CAPE is extremely high (35+)
- Increase allocation to international markets with lower CAPE ratios
- Focus on sectors with more reasonable valuations
What NOT to Use It For:
- Market timing (when to buy or sell next month)
- Predicting short-term market movements
- Making tactical trading decisions
Combine with Other Indicators:
The Shiller P/E works best alongside other metrics:
Complementary Market Indicators
Buffett Indicator (Market Cap to GDP ratio)
Put/Call Ratio for sentiment analysis
Yield curve shape and credit spreads
International valuation comparisons
Sector rotation and earnings growth trends
Federal Reserve policy and real interest rates
The Jeremy Siegel Controversy
Wharton professor Jeremy Siegel argues that CAPE has been consistently wrong since 1990 due to accounting changes. Between 1981-2015, CAPE signaled overvaluation in 416 out of 422 months, yet investors who followed this signal missed massive gains. Siegel believes the "new normal" CAPE should be around 25-30, not the historical 17. Shiller counters with his "Total Return CAPE" that accounts for buybacks, but the debate continues.
Understanding the Limitations
While the Shiller P/E ratio is valuable, it has important limitations that every investor should understand:
Timing Is Everything (And CAPE Can't Time) The biggest misconception about CAPE is that it can help you time the market. It can't. CAPE has been above 25 for most of the period from 2018-2025, yet the market delivered strong returns. CAPE is excellent for 10-20 year forecasts but useless for predicting what happens next year.
The Accounting Standards Problem Critical changes in accounting standards since 1990 may make current CAPE readings artificially high compared to historical periods. Mark-to-market accounting requires companies to write down assets that weren't actually sold, mechanically reducing reported earnings and inflating CAPE.
Composition Bias Today's S&P 500 is dominated by technology companies with naturally higher growth rates and profit margins. Comparing today's tech-heavy index to the industrial-heavy index of 1950 may be like comparing apples to oranges.
The Buyback Revolution Companies today return cash through share buybacks rather than dividends. This changes the math of CAPE calculations because buybacks boost per-share earnings without appearing in the traditional CAPE formula. Shiller's "Total Return CAPE" attempts to address this.
What CAPE Doesn't Account For
Changes in corporate payout policies (buybacks vs. dividends)
Shifts in industry composition over time
Improvements in corporate efficiency and profit margins
The impact of passive investing on market structure
Globalization effects on earnings and growth
Regulatory and tax environment changes
Is the Shiller P/E Ratio Reliable? The Honest Answer
The short answer is: it depends on what you're trying to predict and over what timeframe.
Where CAPE Excels:

10-20 year return forecasting: CAPE has an R² of 0.78 for predicting 10-year returns (1983-2015), making it highly reliable for long-term planning
Identifying major market extremes: CAPE successfully identified the 1929, 1999, and 2007 peaks before major crashes
International comparisons: The CAPE/return relationship holds across global markets
Where CAPE Fails:

Market timing: Virtually zero correlation with 1-year returns
Tactical decisions: Can stay "wrong" for years (like 2017-2024)
Sector allocation: Doesn't account for different growth rates across industries
The Academic Evidence: Multiple peer-reviewed studies confirm CAPE's reliability for long-term forecasting while acknowledging its limitations for shorter periods. The key is using it for what it's designed for: setting realistic long-term expectations, not timing your next trade.
Real-World Track Record: CAPE correctly warned about major bubbles but also gave false alarms. An investor who went to cash when CAPE hit 30 in early 2018 would have missed massive gains through 2025. However, an investor who used CAPE to reduce equity allocation and diversify internationally would have been better positioned for various scenarios.
Historical CAPE Levels and Market Outcomes
Major market peaks and crashes since 1920
International Perspective
While U.S. stocks trade at a CAPE of nearly 40, many international markets offer better value. European markets generally trade at significantly lower CAPE ratios, and emerging markets often provide the best valuations combined with higher growth potential. This suggests geographic diversification may be more important than market timing.
The Bottom Line: Using CAPE Wisely in 2026
The Shiller P/E ratio near 38 is sending a clear message: expect below-average returns over the next decade. But that doesn't mean you should panic or abandon stocks entirely.
Smart investors in 2026 should:
- Use CAPE to set realistic return expectations (2-5% annually vs. historical 7-10%)
- Consider geographic diversification to markets with lower CAPE ratios
- Focus on sectors with more reasonable valuations (financials, healthcare vs. technology)
- Understand that high CAPE doesn't predict timing - markets can stay expensive for years
- Combine CAPE analysis with Excess CAPE Yield to account for the interest rate environment
Remember: CAPE is a compass for long-term direction, not a GPS for daily navigation. Use it to plan your 10-20 year investment strategy, not your next trade.
The current reading suggests we're in one of the most expensive markets in 140+ years of data. That's worth taking seriously for long-term planning, even if it doesn't tell us what happens tomorrow.
Want to find a broker for your next investment? Check out our Investment Broker Comparison Page with our top recommendations.
FAQs
 Should I sell all my stocks when CAPE is this high?
No. CAPE is a long-term valuation tool, not a market timing signal. High CAPE suggests lower future returns over 10-20 years, but markets can stay expensive for years. Consider reducing allocation or diversifying rather than going to cash.
Why is CAPE better than regular P/E ratios?
Regular P/E ratios can be distorted by temporary earnings spikes or crashes. CAPE smooths out these fluctuations by using 10 years of inflation-adjusted earnings, giving a clearer picture of long-term value.
What's the difference between CAPE and Excess CAPE Yield?
CAPE looks at stock valuations in isolation, while Excess CAPE Yield (ECY) compares stock returns to bond yields. ECY helps determine if stocks are attractive relative to other investments, not just historically expensive.
Can CAPE be used for individual stocks?
Yes, but it's most reliable for broad market indices. Individual companies can have dramatic business model changes that make 10-year earnings averages less meaningful than for diversified indices.
How often should I check the CAPE ratio?
Since CAPE is a long-term indicator, checking it monthly or quarterly is sufficient. Daily movements are meaningless for a metric designed to smooth out short-term fluctuations.
What is the difference between regular P/E and Shiller P/E?
The regular P/E ratio divides the current stock price by only the most recent 12 months of earnings. The Shiller P/E (CAPE) uses 10 years of inflation-adjusted earnings instead. This longer timeframe smooths out business cycle fluctuations, recessions, and temporary earnings booms, giving a more stable and historically reliable picture of whether stocks are cheap or expensive relative to their long-term earning power.
What Shiller P/E level indicates the market is overvalued?
The historical mean Shiller P/E is about 17.3. Readings above 25 are generally considered expensive by historical standards, and levels above 35 have historically been associated with poor long-term returns and increased crash risk. However, some analysts argue that structural changes like higher profit margins and the growth of passive investing justify a 'new normal' CAPE in the 25-30 range. As of early 2026, the S&P 500 CAPE sits near 38, well above any proposed 'normal' threshold.
Sources
Cyclically Adjusted Price-to-Earnings Ratio - Wikipedia
CAPE Ratios by Sector - Siblis Research
Vanguard 2026 Economic and Market Outlook - Vanguard
Comments
Only registered users can leave comments.