Financer US Semi-Annual Report 2022
- December 26, 2023
- 9 min read
-
 64 reads
2022 Report Summary
The first six months of 2022 have been exceptional for Financer.com and its stakeholders. Some of the key metrics were the following:
- 1 million users monthly traffic
- 9 million pageviews
- 586 thousand loan offer clicks
- €50+ million estimated generated loans
In this report, 12 interactive charts and maps show the US market’s performance for the first six months of 2022 compared to the same period in 2021.
All data are retrieved via Google Analytics API and are cross verified via our internal tracking tools.
2022 Statistics & Metrics
Users by Market
During the first six months of 2022, Financer.com US saw a significant increase in total users, up from 88,498 to 211,307. This represents a 138% increase as can be seen below.
Users % Change by Market
The US market, with its 138% increase in users between January 1 and June 30 this year, achieved the fourth-biggest growth of all markets, following Indonesia, Poland, and Kazakhstan, respectively.
Bounce Rate by Market
The average bounce rate across all markets has been just 76%, which is 2% less than the previous year, and well below the industry average.
The US is one of the markets with the lowest bounce rates with 58.82% together with Indonesia, Georgia, France, and Bulgaria.
Session Duration By Market
Overall, session durations have decreased slightly in 2022, expected due to a larger percentile increase in organic traffic on informational articles with higher bounce rates. Despite the slight global decline, the average session duration in the US increased to 77.1 seconds, which is on par with competitor standards.
Redirected Users % Change By Market
This is a critical success metric and one that the US market really excelled at. It represents the number of users who click and redirect to loan offers. The US increased this number by 251.82% compared to 2021.
With these redirects, we promote more than 290 financial institutions and 180 loan offers across the US.
Redirect Rate By Market
Another critical success rate is how often a website visitor engages with at least one of our loan offers, also known as the redirect rate. Redirect rates vary across markets based on the lending terms, availability of financial products, economic growth, and financial market stability.
The US saw a 10.38% increase in its redirect rate for the first six months of 2022, compared to the same period of 2021.
Slider Users % Change By Market
As a financial product comparison engine, one of the key metrics is how often we use our loan comparison tool (known as the “slider”). Increased slider usage indicates more engaged visitors who want to take a loan.
As seen in the chart, most markets saw increases in their slider users, with the US achieving a 50.23% increase.
Website Technical Metrics
Another component of success for Financer.com is its top-class page speed and server performance. The development team has been working tirelessly to deliver the fastest, most secure, and most reliable service to more than one million monthly users from across the globe.
Below you can see some of our stellar website technical metrics:
Avg. Page Load Time (s)
23 markets have seen a decrease in total page load time, despite increasing the depth of content and interactive graphics. This decrease allows for an even smoother user experience. The US market decreased its load time from 3.1 seconds to 2.2 seconds.
Avg. Page Load Time % Change By Market
All countries with excessive speed loading issues in 2021 have been remedied in 2022. The overall weighted average decrease of page load times across all markets was an impressive -24.40% with the US achieving -29.45%.
Web Vitals Metrics
Similarly, all web vital speed metrics components have been exceptional, with an average collective load of less than half a second. The breakdown across all markets can be seen in the accumulative chart below.
Global Web Vitals Metrics Comparison
As mentioned above, all web vital speed metrics components achieved great results across all markets in 2022.
Web Vitals Metrics % Change by Market
The US saw an improvement on all web vitals metrics in the first half of 2022, with the page download time decreasing by more than 28% and the server response time down almost 48%.
Trusted Partners Program
The Trusted Partner Program is designed to reward our loyal partners with exclusive features that will improve their reputation and profitability. There are three main unique features:
1. Verification badge
Each Trusted Partner will have a blue verification badge next to its logo that will be shown across several touchpoints throughout the Financer.com site, including the company’s main description page.
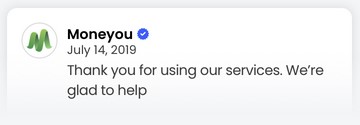
2. Directly reply to users
Trusted Partners can directly reply to users’ reviews and request re-evaluation after addressing their issues.
3. Mark reviews as “inaccurate”
Trusted Partners can also mark spam or malicious reviews as “inaccurate” after conducting their due diligence. Inaccurate reviews are not counted in the average review score and are shown with faded colors and warning labels.

Learn more about the Trusted Partners program here, or directly apply to enroll using the button below:
Growing the US Market in 2022 and Beyond
The team of Financer.com is committed to offering a world-class service to all our stakeholders. We will keep prioritizing providing the most well-researched and up-to-date financial content and the most extensive database of financial products to our users.
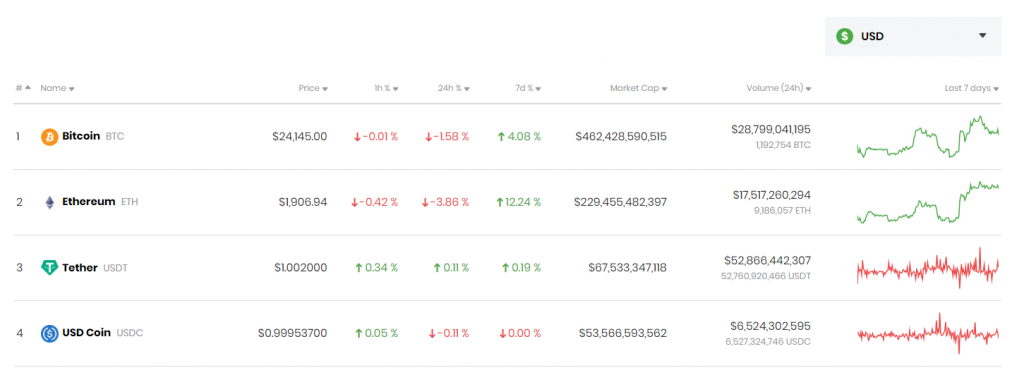
Crypto
We are committed to expanding our services to cover the ever-growing needs in the finance industry. For this reason, in 2022, we’ve launched a series of content on crypto, including an in-depth comparison of the top cryptocurrencies, with live crypto prices, updated in real-time, and easy-to-use crypto calculators.
We also compare the best cryptocurrency exchanges throughout the US.
Peer-reviewed Content & User Feedback
We have also added peer-reviewed mechanisms in our content to allow other finance experts to contribute and verify our data.
Moreover, we included new user feedback collection options across all our posts to help us optimize our content further.
For the second half of 2022, we are working on delivering more quantitive data reports and charts evaluating global economic and financial indicators.
Major upgrades will also be implemented to increase community engagement, feedback, and rewards.
Last, we are working on improving our internal tracking systems and delivering more AI experiments and optimizations based on performance metrics that will help our partners increase their profitability.
If you have any questions about this report, please let us know using this contact form.