What is the 10Y Treasury yield?
The yield on US 10-year Treasury bonds is one of the most important indicators of the global economy. This is the yield on 10-year bonds sold by the US Treasury and at which these bonds trade in the secondary market.
Changes in this indicator reflect investor expectations for inflation and interest rates. US government bonds are also a safe haven asset, and changes in the yield reflect changes in risk appetite amongst investors.
Investors can use the 10Y Treasury yield in several ways to help them make informed decisions.
Understanding 10Y Treasury prices and yields
Treasuries are bonds issued by governments to fund expenditure. They pay a fixed interest rate, known as a coupon, each year until maturity. Upon maturity, the face value of the bond (the principal) is returned to the bondholder.
Bonds can be traded based on their YTM (yield-to-maturity) or price which are inversely related. When bond prices rise, their effective yield-to-maturity falls and vice versa. Conversely, when interest rates rise, bonds become less valuable, so their prices fall and their yield-to-maturity rises.
The result is that the yield on 10-year Treasuries rises when supply exceeds demand and falls when demand exceeds supply.
Example:
10-year Treasuries issued on 15 February 2022 have maturity on 15 February 2032:
- The coupon is 1.875% which is the yield to maturity if the bonds are purchased at their par value of 100.
- If demand for bonds causes the price to rise to 105, the yield will fall 1.34%.
- If bonds sell off and the price falls to 95, the yield will rise to 2.44%.
You can approximate the yield on a bond using the following formula:
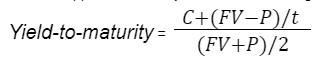
Where:
- C= Coupon (interest per year)
- FV = Face Value
- P = Price
- t = years to maturity
Note: This formula will give you the approximate yield. Calculating the actual yield requires a process of trial and error.
It’s important to note that the price a bond trades at will depend on the difference between current yields and the bond’s coupon. While bonds are often quoted according to the current price, the yield is the key number.
What is the current 10Y Treasury yield?
On the 5th March 2022, US 10-year Treasury bonds were trading at a price of 101.39 with a yield of 1.722%.
- The lowest yield during the previous 12 months was 1.19%.
- The highest yield during the previous 12 months was 2.05%.
Historically, the lowest yield was 0.55% during July 2020 and the highest yield was 15.68% in September 1981.
Key levels for the 10Y Treasury yield
10-year Treasury yields have traded in a 15% range over the last 50 years, with major changes in the yield reflecting changes in the economy and changes in the central bank’s approach to managing inflation.
Between 1960 and 1981, the yield rose from 4% to nearly 16% This period began with rapidly rising consumer spending in the US and ended with the oil price shocks of the 1970s. In this environment, it wasn’t surprising to see interest rates rise as the US Federal Reserve struggled to combat rising inflation.
The 10-year yield peaked at 15.68% in 1981 and gradually drifted lower for the next 39 years, reaching an all-time low in 2020. This decline can be attributed to falling inflation, which is mostly a result of productivity gains and globalization.
In addition, the US central bank has introduced new monetary policy tools, which means it is less reliant on interest rates.
In 2021, inflation rose at the fastest pace since 1990, due to supply chain issues that resulted from the Covid-19 pandemic. This suggests the 39 year bull market may end, though only time will tell if this is the case.
How to use the 10Y Treasury yield?
The 10Y Treasury yield won’t tell you whether the stock market is overvalued or undervalued like other valuation metrics – but it can provide valuable insights about the economy and markets.
Changes in the yield can reflect changing expectations about inflation and interest rates as central banks raise interest rates to combat rising inflation.
US interest rates are determined by the Federal Open Market Committee, but bond investors expect the actions of the committee by buying and selling bonds which cause the yield to move up and down.
AAA rated government bonds are also regarded as being the closest available instrument to a ‘risk free asset’. When economic uncertainty rises, investors often move capital to safe haven assets like government bonds and gold, causing the yield to fall.
The 10-year yield is also widely used as the risk-free rate when calculating the value of stocks and other financial instruments. If the yield rises, other riskier assets can become less attractive to investors.
Because changes in the bond yield can reflect different market dynamics at different times, stock prices and bond yields sometimes move in the same direction, and sometimes they move in different directions.
How quickly the yield changes can also reflect different market dynamics.
Gradual increase in yields
A gradual increase in yields usually implies that investors are expecting economic growth to continue, which will eventually lead to rising inflation and interest rates. Typically, this is a good environment to own stocks that benefit from economic growth and higher interest rates.
Rapid increase in yields
If yields begin to accelerate, it can imply that investors are becoming concerned that the central banks may raise sooner than expected. This is positive for stocks that have pricing power (the ability to pass cost increases on to customers) and for commodity producers. It can be negative for companies that have to borrow, and for growth stocks.
A rapid rise in yields can also reflect a sudden increase in risk appetite, though this typically occurs after a ‘risk-off’ period.
Gradual decline in yields
A gradual decline in yields may indicate that investors believe economic growth is slowing and the central banks will need to cut rates to stimulate the economy. It can also indicate that the market believes there is downward pressure on inflation.
Lower rates are good for growth stocks and for companies that need to borrow capital. Declining yields may cause rotation from cyclical stocks to growth stocks.
Rapid decline in yields
A rapid decline in yields typically occurs during a ‘risk-off’ period as investors sell risky assets and buy safe haven assets. This can be caused by fears over geopolitical events, a financial crisis, or corporate earnings.
The 10-year yield should always be considered alongside other valuation and sentiment indicators. These include:
- AAII Sentiment
- VIX Index
- S&P Market-Cap Concentration
- Personal Savings Rate
- Buffet Indicator
- Put/Call Ratio
- Margin Debt to Cash
- Velocity of M2 Money Stock
- Debt / GDP ratio
- Unemployment rate
- Shiller P/E ratio
- DXY index
What are the limitations of the 10Y Treasury yield?
The main limitation of this indicator is the fact that it can reflect several aspects of the market, including interest rates, risk appetite and opportunity cost. This means the way it is interpreted can be ambiguous.
It’s also important to note that the economy is constantly changing, and the US Federal Reserve has also altered the way it manages inflation. Changes in the yield today may not mean the same thing they meant in the past.
To counter these limitations, changes in the yield need to be considered in the current market environment.
Is the 10Y Treasury yield a reliable indicator?
The 10-year Treasury yield is one of the most important financial indicators, as it reflects changing expectations for rates in the world’s largest economy.
In addition to the 10Y Treasury yield, you can use our complete list of 12- essential market indicators to make educated financial decisions.