What is the Margin Debt to Cash Ratio?
The Margin Debt to Cash Ratio compares the level of debt being used to fund equity investments with the cash and credit balances in customer accounts. The ratio is calculated using the total value of debit and credit balances in all US brokerage accounts, which are published monthly
Margin debt often rises to historically high levels at equity market tops, and falls to historically low levels at market lows. This means the ratio can be used as a contrarian indicator.
Cash and credit balances are an indication of investors’ potential buying power. When cash and credit balances are low, there may not be enough buying power to keep a market rally going. On the other hand, if cash and credit balances rise as equity markets fall, potential buying power increases. This can affect the magnitude of the next rally.
How to calculate the Margin Debt to Cash indicator?
Every month, FINRA (the US Financial Industry Regulatory Authority) publishes the total value of member firms’ customer accounts. The data includes:
- Debit Balances in Customers’ Securities Margin Accounts
- Free Credit Balances in Customers’ Cash Accounts
- Free Credit Balances in Customers’ Securities Margin Accounts
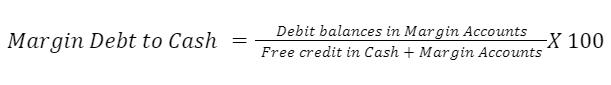
We calculate the Margin Debt to Cash ratio by dividing the debit balance by the sum of the two credit balances. The result can be multiplied by 100 to produce a percentage.
What is the current Margin Debt to Cash Ratio?
The Margin Debt to Cash ratio as of January 2022 is 188%.
During the last 12 months the highest and lowest ratios were 219% and 176% respectively.
During the last 10 years the highest and lowest ratios were 219% and 86% respectively.
What is a good Margin Debt to Cash Ratio for investing?
The margin debt to cash ratio has trended higher over time, and particularly in the last ten years. This means that investors should be cautious using absolute levels, but instead compare the ratio to its level over the previous 12 to 24 months.
High Margin Debt to Cash
During the last decade the ratio has peaked at successively higher levels of 117, 161, 199 and 219%. These peaks have occurred when the ratio was 10 to 35% higher than the previous peak. These highs have all been followed by a substantial correction or increased market volatility.
Low Margin Debt to Cash
Market lows have occurred when the ratio has fallen to 86, 129, 158, and 114%. The margin debt to cash ratio has typically declined by 10 to 25% during market corrections, after which the equity market’s uptrend has resumed.
How to use the Margin Debt to Cash indicator?
This ratio is considered a contrarian indicator as it can indicate levels of extreme bullishness or bearishness. However, it is difficult to use as a market timing tool as the ratio does not turn at consistent levels.It can however be very useful for risk management and to estimate the potential magnitude of the next move in the equity market.
When the ratio is at historically high levels it may indicate that investors using margin accounts are running out of buying power. Investors who use leverage often become forced sellers during market corrections, so a high ratio can also result in a deeper correction.
Conversely, a low or falling margin debt to cash ratio reflects increased buying power. More buying power can result in a faster recovery as investors scramble to get back into the market.
In some instances when the ratio has made a new high, equity markets have continued a persistent rally.
Margin debt is often associated with speculative investing. The implication is that the more speculative sectors and stocks are more sensitive to rising and falling margin debt.
We recommend that you don’t use this ratio as a standalone tool, but use it to complement your analysis using other market metrics. Such metrics include:
AAII Sentiment
VIX Index
S&P Market-Cap Concentration
Personal Savings Rate
Buffet Indicator
Put/Call Ratio
DXY Index
Velocity of M2 Money Stock
Debt / GDP ratio
Unemployment rate
Shiller P/E ratio
Some investors also calculate a ratio comparing margin debt to the market capitalization of the entire market. It’s also worth referring to the absolute level of cash and credit balances as this reflects investors’ capacity to invest.
What are the limitations of using Margin Debt to Cash?
There are several factors to be aware of when using this indicator. The first is that margin debt has become more widely used over the last four decades. In addition, the historically low interest rates of the last decade has made margin debt more affordable. The result is that the margin debt to cash ratio has risen persistently over time.
Another aspect of the ratio to consider is that margin debt only accounts for around 1.5 to 2.5% of the value of all US stocks. While debt levels have risen significantly, leveraged investments still account for a relatively small percentage of the entire market.
Is the Margin Debt to Cash Ratio a reliable indicator?
This indicator is not very reliable as a stand alone indicator. However, it can be useful if you use it alongside other market analysis tools. In addition to the Margin Debt to Cash Ratio, you can use our complete list of 12- essential market indicators to make educated financial decisions.