What is the Buffett Indicator?
The Buffett Indicator is a metric that reflects the overall valuation of the US stock market. The indicator is expressed as the aggregate value of listed US stocks as a percentage of US GDP. The indicator is sometimes referred to as the Market capitalization-to-GDP ratio.
The indicator was first suggested by Warren Buffett in an article in Fortune magazine in 2001. Buffett used the ratio to reflect the market’s total valuation as percentage of gross national product, and how the ratio had varied over the previous 80 years.
The Warren Buffet Indicator can be calculated for any country with reliable data. These days, gross domestic product (GDP) rather than gross national product (GNP) is usually used to reflect economic activity.
How to calculate the Buffett Indicator?
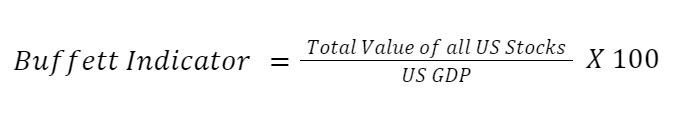
The ratio is calculated by simply dividing the total market capitalization for a country by the country’s GDP for the previous 12 months. This formula refers to the US market, but it can be applied to any country.
The Buffett Indicator is most commonly calculated using the US Wilshire 5000 index, a market capitalization weighted index of the 5,000 most valuable listed companies. The choice of index is not crucial, as long as it includes the majority of listed companies and it is used consistently.
Warren Buffett originally used the aggregate value of US stocks as per the Federal Reserve Economic Data publication (FRED), and the US GNP. Using another index and GDP will therefore result in slightly different values.
The Buffett Indicator has trended higher over the last 100 years. To allow for this, the indicator is sometimes detrended. This means the historical ratio is adjusted so that the long term average remains flat.
What is the current Buffett Indicator?
As of 15 February, 2022, the Buffett Indicator was 190%.
On 1 January 2022 the indicator was 202% and a year earlier it was 183.7%.
The indicator has fallen from record high levels, but remains extended by historical standards.
As mentioned, various different inputs can be used to calculate the indicator and it’s important to compare the current level with historical levels calculated with the same inputs.
What is a good Buffett Indicator level for investing?
There are two ways to consider the level of this indicator. The first is to simply look at the absolute percentage. When he proposed this indicator, Warren Buffett stated that 70 to 80% was a good level to buy stocks, and that at 200% “you are playing with fire.”
In absolute terms, the ratio peaked at close to 100% during the 1960s, at 150% in 2000 and at over 200% in 2021. The low points during the 1970s and 1980s were close to 40%, in 2009 the indicator fell to 56% and in March 2020 it fell to about 125%. These levels clearly indicate the way in which the indicator has trended higher over time.
The second approach is to compare the indicator to its historical average in percentage terms or standard deviations from the mean. This approach accounts for the fact that the indicator has trended higher over the long-term.
High percentage
In relative terms, valuations have proved to be too high when the indicator is close to 2 standard deviations, or 50 to 60%, above the long term average.
Average percentage
The long term average for the Buffett indicator is now around 120%. This could be regarded as ‘fair value’ for the stock market.
Low percentage
The lowest levels for the indicator have been 1 to 1.5 standard deviations or 40 to 50%, below the long term average. However, equity prices have also recorded major lows when the indicator was at or just below the long term average.
How to use the market capitalization-to-GDP ratio?
The Buffett Indicator is best used as a risk management tool rather than a market timing tool. Equity valuations are an indication of investor expectations about the future, and future returns depend on how accurate those expectations are.
If the indicator is at historically high levels, you shouldn’t assume that stock prices will fall. Rather you should be aware that valuations may be at risk if reality doesn’t live up to the market’s expectations.
Similarly, if the indicator is at historically low levels, it suggests that expectations are low. This means there is less downside risk, and there is potential for strong returns if expectations turn out to be too pessimistic.
The Buffett Indicator is a long-term indicator and is of most value to long-term investors. The indicator can trend higher and lower for decades, and even tops and bottoms have taken several years to play out.
To get the most value out of the indicator, it should be considered alongside other market metrics. These include:
- AAII Sentiment
- VIX Index
- S&P Market-Cap Concentration
- Personal Savings Rate
- Put/Call Ratio
- Margin Debt to Cash
- Velocity of M2 Money Stock
- Debt / GDP ratio
- Unemployment rate
- Shiller P/E ratio
- DXY index
What are the limitations of the Buffett Indicator?
Warren Buffett acknowledged that the indicator is quite simplistic. There are several factors that can justify higher valuations that are not accounted for by the indicator. Innovation, higher productivity, low inflation and low interest rates can all lead to higher valuations. These factors may explain the long-term uptrend for the indicator.
The indicator also doesn’t account for the percentage of a country’s companies that are publicly listed, and how that changes over time. If more companies become publicly traded, the indicator would rise regardless of actual valuations.
The proportion of listed and unlisted companies also varies from one country to the next. For this reason the indicator cannot be used to compare equity valuations in different countries.
Is the Buffett Indicator a reliable indicator?
The detrended market capitalization-to-GDP ratio has been quite consistent with market tops. The indicator peaked at close to two standard deviations above the mean when the market peaked in 1968 and 2000. It peaked at the same level in 2021, although it may be too soon to call that a major market turning point.
When it comes to major market lows the indicator has been less consistent. Major lows have been recorded with the indicator at various points between the mean and two standard deviations below the mean.
There are not enough data points for analysis of the indicator to be statistically meaningful. Nevertheless, the Buffett Indicator does a very good job of telling us what type of market environment we are in, and whether valuations may be overextended.
In addition to the Buffett Indicator, you can use our complete list of 12- essential market indicators to make educated financial decisions.